
Development of iot-based energy management system for hybrid refrigeration system
(Legacy Project) Development of iot-based energy management system for hybrid refrigeration system in eco reefer container
Tech Stack
Key Features
- Energy Management System
Challenges
- Hollistic System Solution
(Legacy Project) Development of iot-based energy management system for hybrid refrigeration system in eco reefer container
Abstract
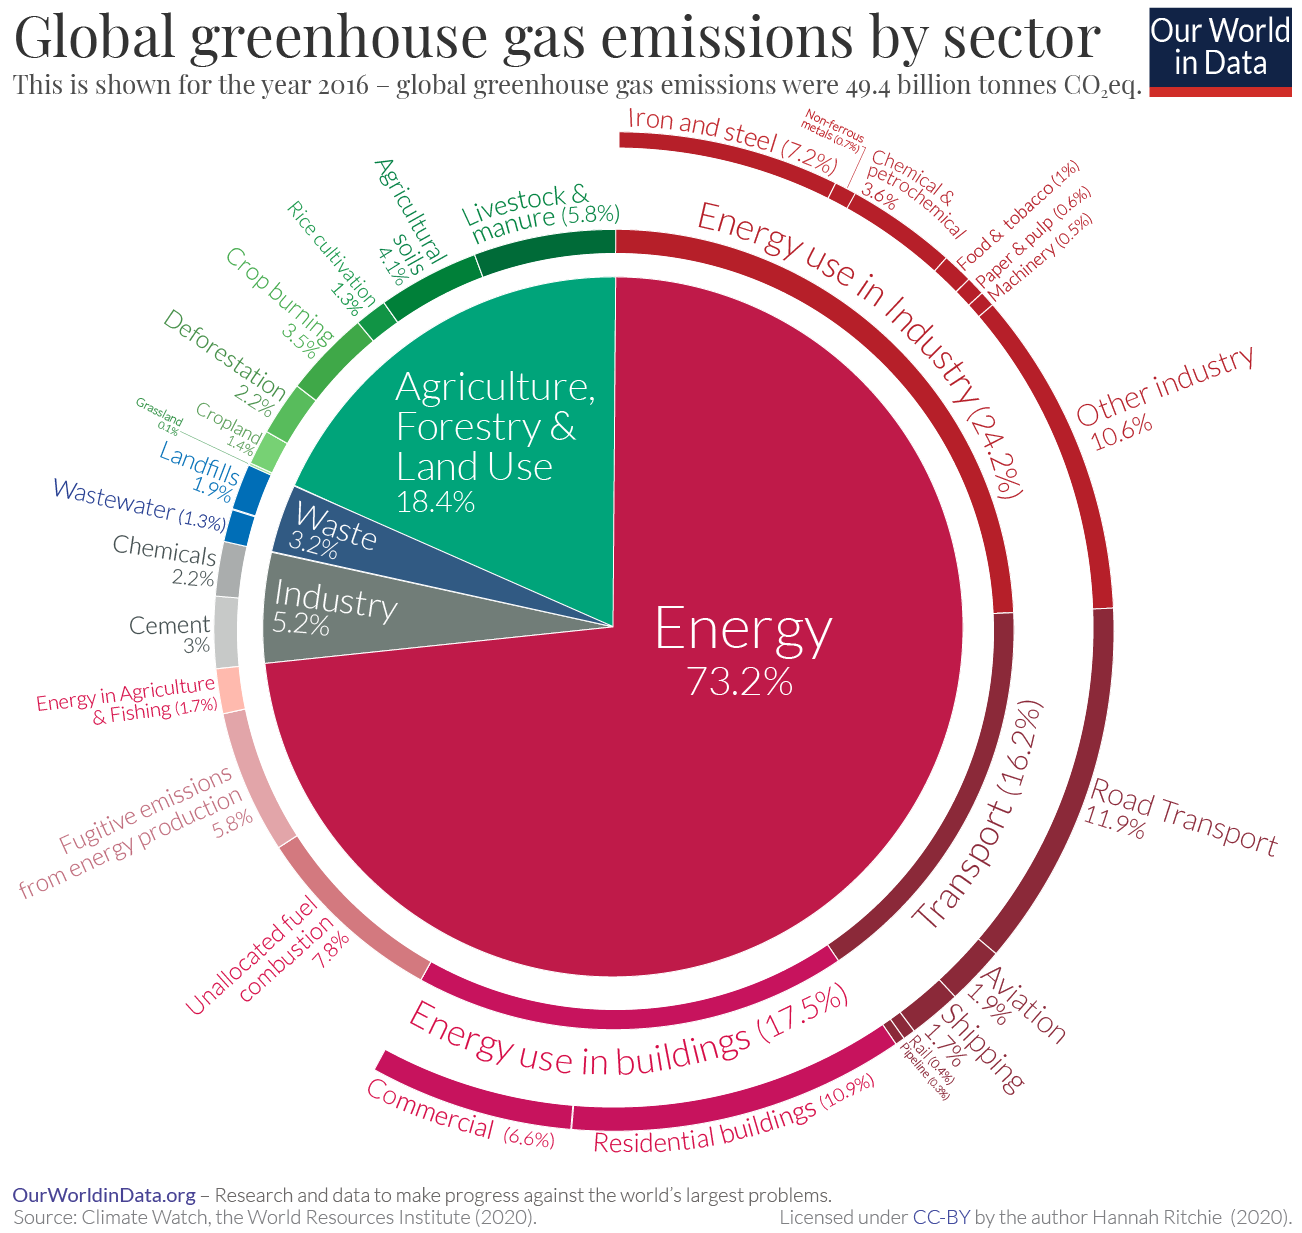
In 2016, there are various sectors that contribute to the generation of pollutants such as CO2, where the dominating sector is the energy sector and one of the sub-sectors in the energy sector is shipping. One mode that is experiencing an increasing trend of use in sea transport is the use of refrigerated containers. The use of refrigerated containers poses its own challenges in port services at the terminal. Maintaining temperature and humidity variations is a critical factor to avoid certain effects that affect product quality. A decision must be made quickly when an abnormality occurs in a refrigerated container. Abnormalities can occur due to various factors such as human error (60-70%), technical constraints (25-35%), or extreme environment (5-15%).
This project proposes an IoT-based (internet of things) energy management system as an effort to save energy and reduce the frequency of human error in abnormalities that occur when refrigerated containers operate. Energy saving efforts are made by utilising phase change materials that can absorb latent heat in refrigerated containers so that the material can be used to maintain temperatures within a certain range without using a vapour compression refrigeration system that uses electrical energy, where the monitor and control of the hybrid cooling system can be done by stakeholders through a web-based dashboard so there is no need to interact on-site as long as the proposed system controller is connected to the internet.
The controller connects to the server through message queuing telemetry transport protocol and the server communicates to the client through representational state application programming interface. The average response time of the monitor and control in the hardware display is about 3 seconds. While in the server, the average response time for each endpoint is about less than 1 second.
As a validation of the proposed energy management system, several performance tests were conducted between before and after the implementation of the energy management system into the refrigerated container. Recorded using the monitoring and control features of the proposed energy management system and data taken from the data logger, within a range of about 24 hours, the refrigerated container is able to save energy consumption by 13.73% for no-load conditions and by 6.93% for load conditions.
Keyword: internet of things, message queuing telemetry transport, phase-change material, representational state application programming interface, vapor compression refrigeration system.
Dashboard Demonstration Link: https://frontend-iot-mms.vercel.app/
Background
Mitigating global warming, one of which is minimizing the carbon footprint, is one of the UN (United Nations) SDGs (Sustainable Development Goals) for all countries. This was done so that the increase in the earth’s average temperature after the pre-industrial period might be kept to 2°C (United Nations, 2015). In 2016, many sectors, such as the energy and agriculture sectors, contributed to CO2 emissions. Energy sector is dominating the emissions, whlist maritime transportation accounts for 1.7% of total (Ritchie et al., 2020).
Globalization has increased trade and transit of goods between countries or islands. Maritime logistics accounts for approximately 85% of international traffic in products (UNCTAD, 2022). This implies that cargo delivery by sea is critical in global or inter-island logistics operations.
In one of sea logistics operation, a specific temperature and humidity range is required while shipping certain commodities in order to maintain the commodity’s quality. The Reefer Container is one tool that can be employed. The Reefer Container is a device that uses a vapor compression refrigeration cycle to provide the appropriate temperature, with the four main components (compressor, condenser, expansion valve, and evaporator) consuming considerable quantities of power.
Several developments have been carried out on a reefer container such as the use of IoT and the addition of early-warning in critical conditions (Srivatsa et al., 2021). Meanwhile, in terms of the refrigeration system, PCM (phase-change material) with 22% NaCl 35% Glycol composition can keep the room temperature below -10 for around 4 hours. The research object in this example is a half ton reefer container, with the needed PCM being roughly 56 kg (Satriawan, 2022).
To reduce emissions in the energy or shipping sectors, this project was conducted on the topic of establishing an energy management system with the goal of making energy consumed more efficiently thus lower operation cost, and users can make more efficient decisions based on conditions (data), by utilizing internet of things and PCM. This post is to discuss about the project with simplified explanation so that when I’m rereading it, it won’t be overwhelming to reunderstand again.
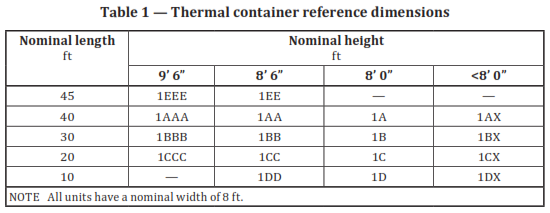
Reefer Container
Container that used to transport cargoes in ships are standarized in 20ft and 40ft in length, with certain dimensions. This standards would make cargoes transporting in all container ships convenient. Imagine if each container has different size and material strength, then the loading unloading process for a container ship will be very troublesome for different ship since they have to consider tha layout of container to maximize cargo space and safety. Beside the size, they also have a set of international standard for a container to be allowed for used in shipping. However, we won’t discuss about these standards, instead we only focusing on improving the energy use of a refrigerated container, and control it by using an iot-enabled embedded system.
First thing first, one of the differences between refrigerated and regular containers, are that the refrigerated containers apply vapor compression refrigeration cycle to achieve certain low temperature, for up to -30°C. It’s commonly used in various products, such as air conditioning and refrigerator. There are 4 main components of this cycle: compressor, condensor, expansion valve, and evporator. Simply, those components with certain spesifications are connected with a copper pipe with certain dimensions, so that a refrigerant could flow trough them to follow a certain cycle. A refrigerant is a working fluid used in refrigeration cycle where in most case they undergo a repeated phase transition from a liquid to a gas and back again. In this case, refrigerant is at low temperature when they flow after expansion valve until before compressor. When a refrigerant flow in an evaporator, a fan will blow the cold wind to a container so the cold would be spreaded. An evaporator coil is used so that a working fluid become a gas again when entering a compressor.
So, how do the hybrid side come into play?
We’re benefetting a phase-change material (PCM) characteristics which are able to absorb latent heat in certain phase-change temperature. According to previous research such as from (Satriawan, 2022), below this certain temperature a PCM will be able to maintain a low temperature for some hours. So, when the refrigeration unit is on, the PCM will be charged until a certain low temperature so that the PCM can be utilized. This step is called charging. Then, when the PCM is ready to be utilized, we could use it instead of the vapor compression refrigeration cycle to maintain the low temperature. This step is called discharging.
Note that different cooling load and the dimension of the space may affect in how much PCM required to maintain the desired temperature. Also, there are various type of PCM available for different use case, but we use the 18% NaCl PCM since it’s easy to make and the substance is available in the market for it’s technical grade.
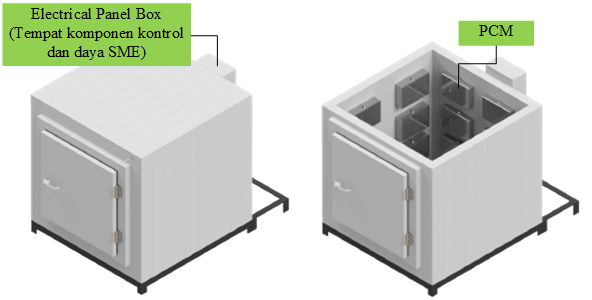
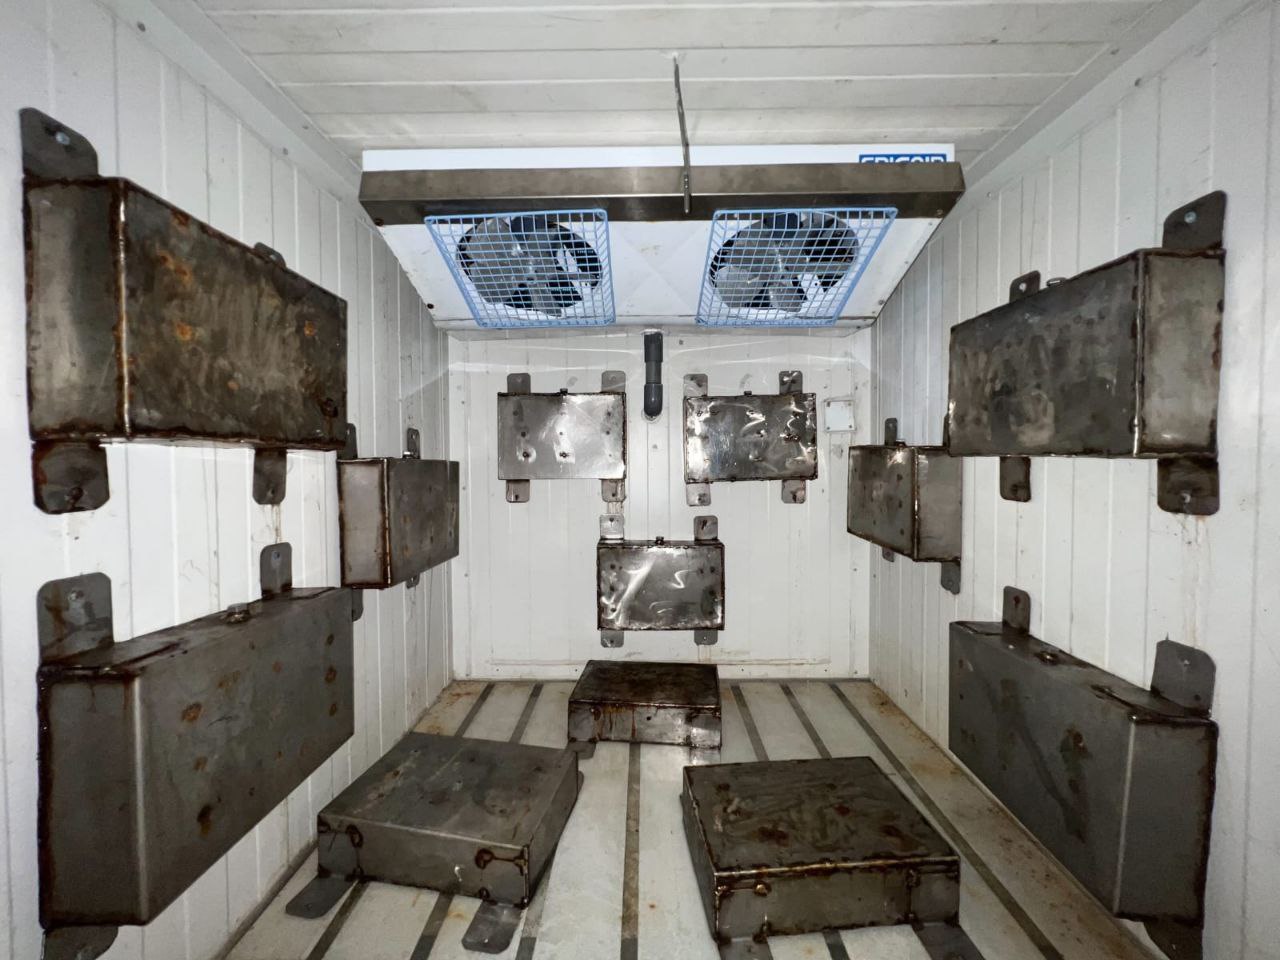
In this project, we are using a 1/2 ton reefer container prototype to utilize our hybrid refrigeration system and it’s iot-based energy management system. The components that required electricity such as compressor and fans are powered by 220 VAC from 1-phase power source, with the following diagram.
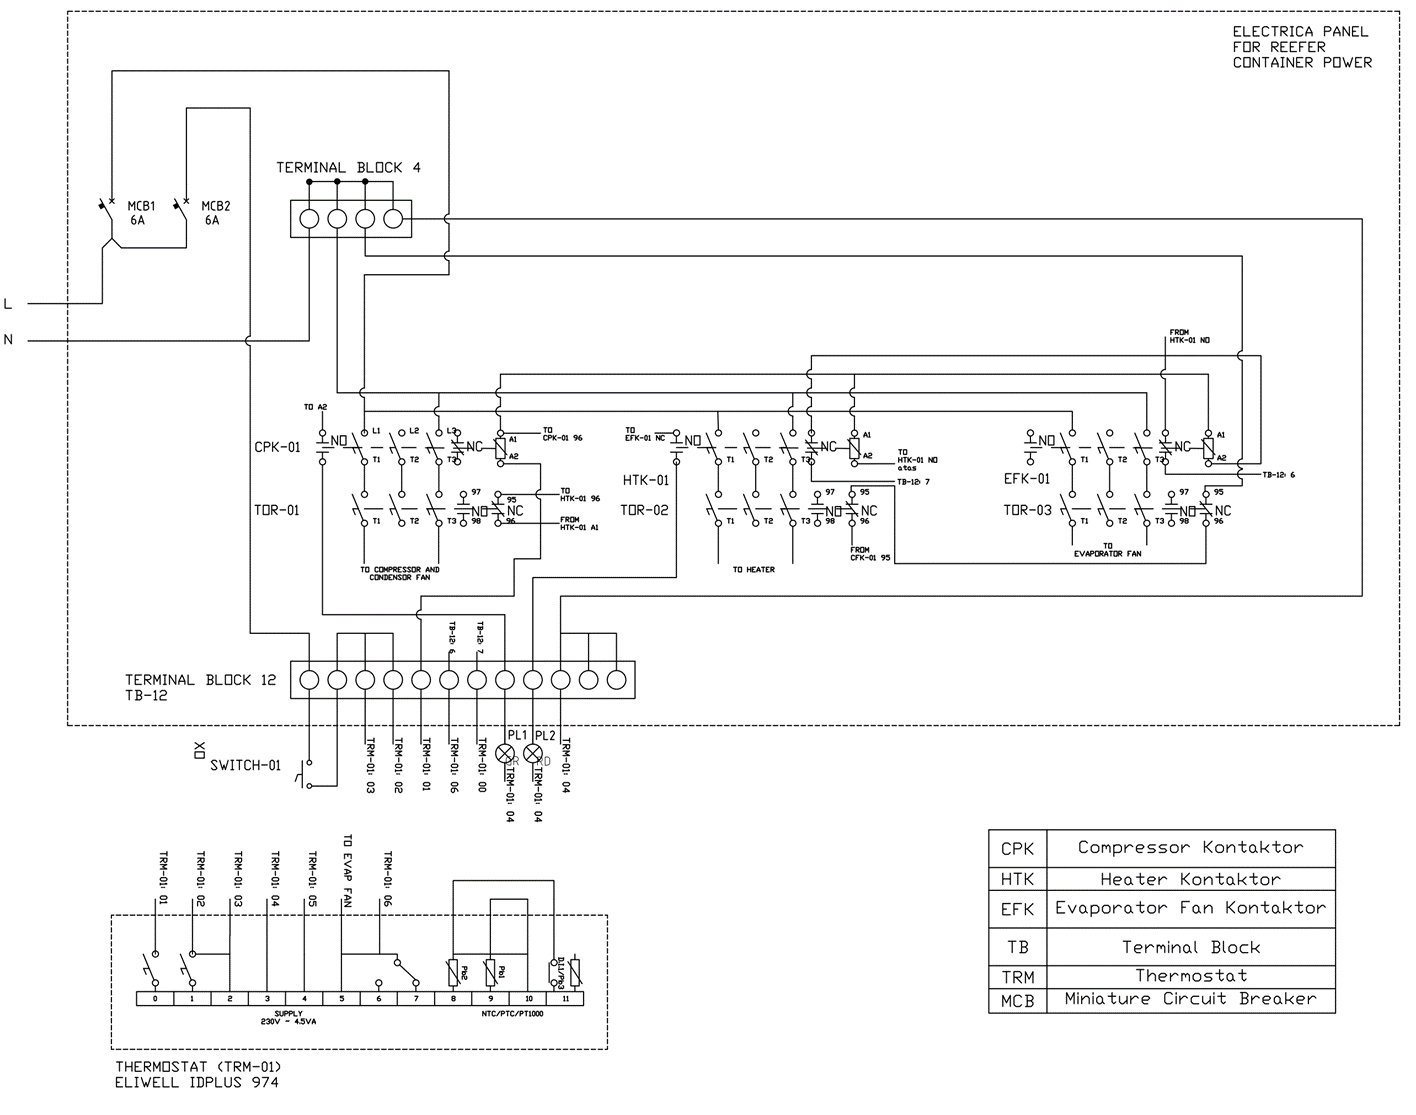
As can bee seen, there are 3 contactor in electrical panel drawing above:
- First contactor is to control compressor and condensor fan, which has been parallelled in one package.
- The second contactor is to control heater inside the reefer container, near evaporator coil and it’s fans.
- Third contactor is to control evaporator fan.
From here on, probably some of you start to get the idea about how we arrange arduino-programmed switch with iot-enabled. Yes, we’re using the signal wire from the contactor (usually A1 - A2 terminal) that we connect to a relay module that connect to the arduino. From there on, it’s only matter of how we program the relay to switch each contactor. On the other word, our control is actually a simple on-off control, or sometimes called a bang-bang control temperature.
This is because the existing compressor in our reefer container prototype is a fixed compressor. A variable compressor could be used for better temperature set point control, but for this project we’re using the existing compressor because of time constraint.
For this project, we needed an approximately 14 hours to charge the PCM, to maintain the temperature below about -10 celcius. Using the monitor and control the we develop, we’re about to see how much energy that could we save by ustilizing hybrid refrigeration cycle. To compare or to find the percentage of our energy saving, we need to conduct 4 experiments:
- No load condition without PCM vs no load condition with PCM utilized;
- Load condition without PCM vs load condition with PCM utilized.
In this project, the loads are fresh water packed in bottles to the container’s maximum capacity. We’re conducting with the load also, to see how well the hybrid system will handle in this load condition as opposed with no load condition.
Proposed General Architecture
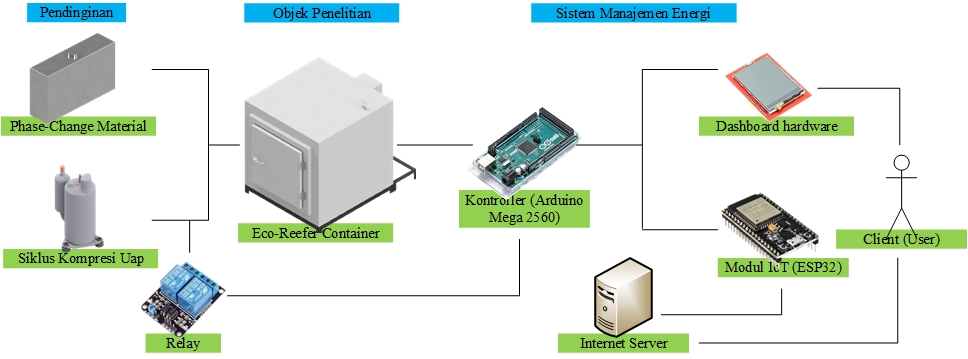
As can be seen, we’re using Mega CH2560 and ESP32 board for our iot-enabled energy management system development. The logic is simple, that is when to charge PCM and when to discharge PCM.
The data from sensor readings are received in Mega board which then to be displayed in human machine interface, and also to be transferred to ESP32 for IoT operation. In addition, the data is also saved in MicroSD card for backup in case the internet is off which make the data couldn’t be saved to database.
Mega and ESP32 board are communicating via serial communication with RX and TX between these two.
Why do we need to transfer data from ESP32 to Mega board?
Remember that in order for user to operate via internet, the data is received by ESP32 board that is IoT-enabled board (which Mega board is’nt). Those data then would be sent from internet by user via buttons in website-based dashboard, to this ESP32, which then again communicate to Mega board, which then would switch the relay based on those signals.
From ESP32 board to internet server, the connections are message queuing telemetry transport. It’s industry standard protocol for IoT, because it’s simple and lightweight messaging protocol (publishing and subscribing) designed for limited devices and networks with high latency, low bandwith, and unreliable network. This suits well when the device are located in remote area with such trouble.
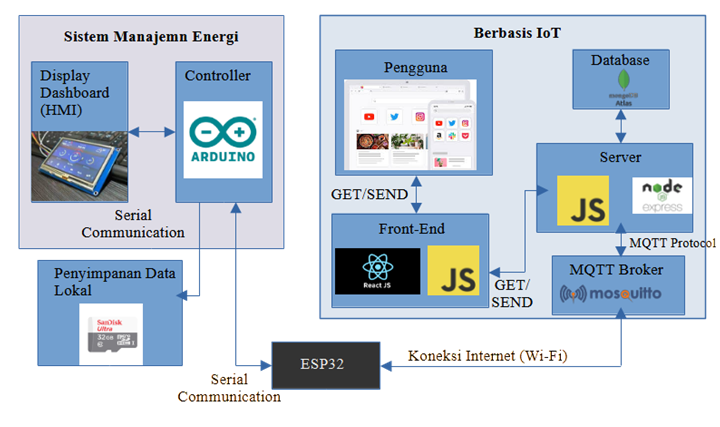
Finally from the internet server that we develop, we build a represenational state application programming interface to connect to the database and save datas into it, and also transfering data between server and front-end (client). Essentially, every event in a web could be programmed to do certain actions. In this case, our actions are sending data to server when a user is clicking a switch button, for example.
Monitoring
As can been seen from screenshoot above, there’s real-time chart for temperature sensors reading. They’re updated approximately every 3 second, and is saved to MongoDB database. Meanwhile, the current reading sensor is installed on first and third contactor, which then could be derived to power as can be seen in second column Status Daya Kompresor.
Control
On the control menu, there’s switch for vapor compression cycle components and button to switch the eco mode.
Results
After the instruments based on the proposed general architecture is assambled, finally we could take the data for some experiment variations as planned to see how much power will be saved by utilising PCM for this reefer container.
There are four variation experiments conducted for this research with different variables.
| No. | Hybrid Refrigeration | Load |
|---|---|---|
| 1. | ❌ | ❌ |
| 2. | ✅ | ❌ |
| 3. | ❌ | ✅ |
| 4. | ✅ | ✅ |
Data conducted from experiment are automatically collected in local database and then storen in a cloud when there’s internet connection. The following are the results for load and no-load conditions.
When the experiment is conducted, there’s also another experiment that conducted synchronously with this project, that is an experiment on tranfroming from single state vapor compression refrigeration cycle into cascade refrigeration system with multiple compressor.
Ideally, the refrigeration system is a fixed variable in out project so the cascade experiment won’t affect directly to our experiment. However, when the research is conducted using cascade refrigeration system, minimum temperature does not reach -20. This will affect in a swing temperature that usually happen in fixed-compressor for vapor compression refrigeration state, thus the experiment become not really representing a normal operating condition. However, that should still acceptable because we want to know the energy saved with utilization of PCM.
A future experiment should be conducted representing normal operating condition that is the minimum temperature reach over -20 celcius.
No-Load Condition
The data is collected until the refrigerated container reaches a balanced condition, so the length of time will be different for different variations of the experiment. Furthermore, according to ISO 1496-2, the intervals of data capture performed should not exceed 15 minutes. For data visualization purposes, the interval for the x-axis of each data is 15 minutes or 900 seconds.
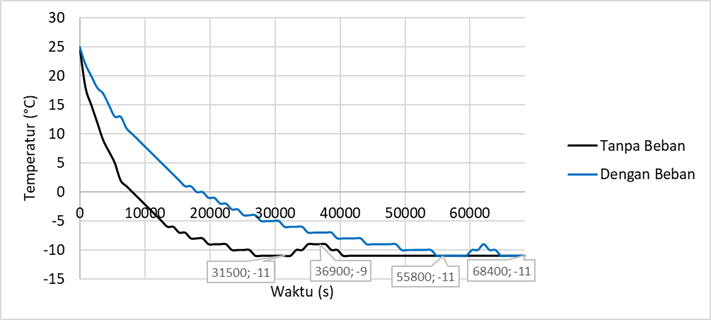
On the other hand, the decrease in temperature between loaded and unloaded conditions has a difference in achieving equal conditions. In non loaded conditions, the equal condition at -11 °C is achieved in 31500 seconds, whereas in the loaded condition, a equal state of -11°C is reached in 55800 seconds. This is because in a loaded state, the cooling load has a more significant value compared to a loadless condition, so the heat generated by the load must also be balanced.
Based on the data readings and assuming the domestic voltage in Indonesia is 220 Volts and the power factor is 0.8, then the average hourly power for each of the following components is equal to
- Low temperature side compressor: 410,69 watts.
- High temperature side compressor: 158,32 watts (the current value is taken as much as the sample under balanced conditions, which is 0.91 A).
- Evaporator fan: 100,65 watts.
So that the data compared is comparable (apple-to-apple), then the time range for each experiment variation is uniformized. In a variation of hybrid cooling experiment, graphic visualization can be divided into two parts, namely when the condition is charging and discharging.
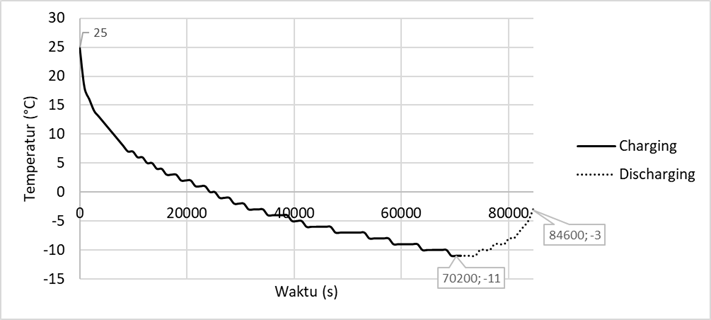
The graph of temperature function with respect to time at the time of charging on this experimental variation shows that the equilibrium conditions are achieved in a longer time than conventional cooling systems, i.e. reaching a temperature of -11°C in 69300 seconds, compared to conventional load-free experiment variations, that is, for 27000 seconds.
Then, through the proposed energy management system, the recorded data and components that use electricity can be switched to see PCM performance. Based on graph 4.30, PCM is able to maintain a temperature in ΔT of 283 K or 10 C in 16200 seconds or about 4.5 hours.
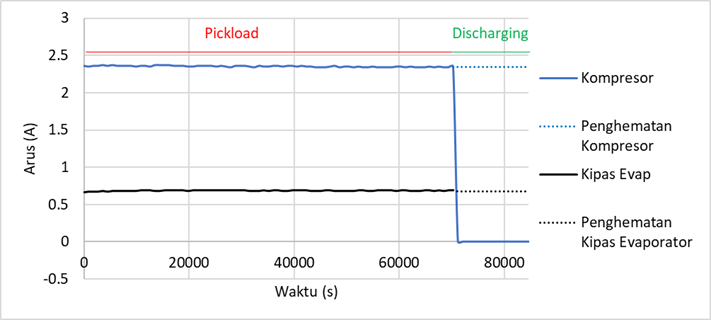
Here is a ratio of energy consumption per hour for variations of experimental load-free hybrid cooling systems with the same assumption on the existing performance sub-bab testing
- Low temperature side compressor: 344,31 watts.
- High temperature side compressor: 133,19 watts.
- Evaporator fan: 100,19 watts.
So the total power consumption in 84600 seconds based on the calculation above is 577.69 watts. If the result is compared directly for the variation of the experiment without load, the difference is 91.97 watt. If you calculate the average value of the energy consumptions in the overall time, the conventional experiment without weight variation consumes 16071.84 watts or 16,07 kW in 24 hours. In percentage, the energy savings were 13.73%.
Load Condition
The following is a graph for the temperature decrease on the conventional experimental variation with the load according to the calculations that have been made on the sub-bab preparation of the apparatus.
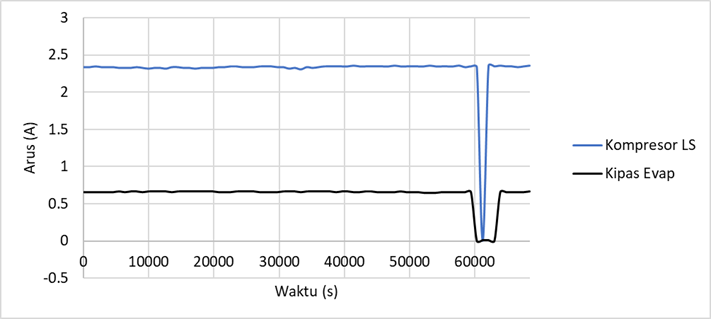
With the same assumption on the previous experiment variations, here are the current ratio values for each component
- Low temperature side compressor: 406,99 watts.
- High temperature side compressor: 158,10 watts.
- Evaporator fan: 110,83 watts.
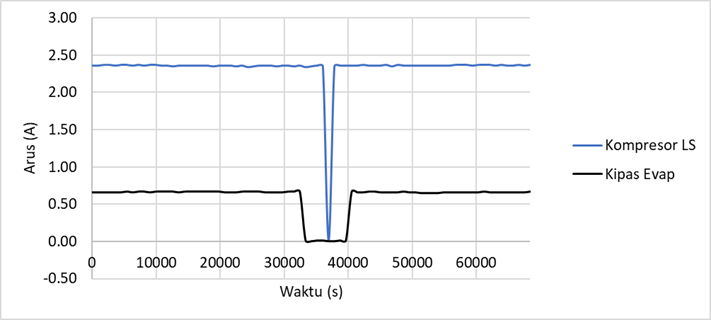
The current-to-time graph for a conventional load experiment variation shows that the compressor is defrosted as often as once, when the temperature in the cooled container begins to reach a balanced state. This is the cause of the temperature rise in the container for the function of temperature against time in the variation of the conventional experiment with the load.
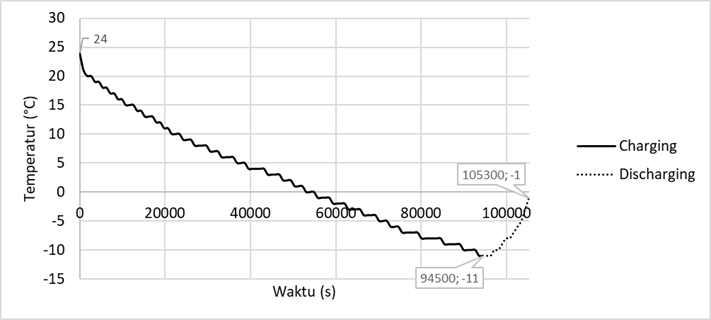
The chart above shows that the time to equilibrium conditions in a loaded hybrid experiment variation takes longer, up to 94500 seconds or 26.25 hours before discharging for 10800 seconds or about 3 hours. During this time, the PCM is able to maintain a temperature in a container in the ΔT range of 283 K or 10 C, about an hour less than for a loadless hybrid experiment variation.
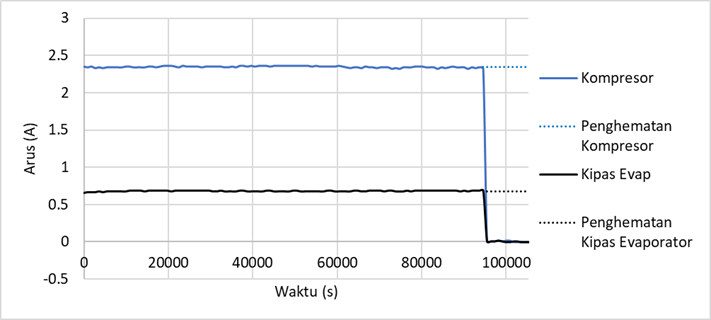
Here is a ratio of energy consumption per hour for experimental variations of hybrid cooling systems with loads, with the same assumption on the existing performance sub-bab testing
- Low temperature side compressor: 370,99 watts.
- High temperature side compressor: 143,87 watts.
- Evaporator fan: 108,36 watts.
So the total power consumption in 105300 seconds based on the calculation above is 623.22 watts. If you compare the results directly for a variation of conventional experiments with a load, the difference is 52.71 watts. If you calculate the average value of such energy consumption in the total time, the conventional experiment variation with the load consumes 16222.32 watts or 16.22 kW in a 24-hour period. In percentage, the energy savings were 6.93%.
Conclusion
Based on data visualization and analysis, it can generally be concluded that energy consumption tends to be more economical on hybrid cooling systems. In other words, the data can be said to be valid regardless of the shortcomings.
Ackowledgement
This research project is conducted in Marine Machinery and Systems Workshop, Marine Engineering Department, Faculty of Marine Technology, Institut Teknologi Sepuluh Nopember in 2023. By the time the research is conducted and finished as written in this post, initially it’s by using personal fund. However, later on the project get a funding from Belmawa to improve the insturmentations and tools used.
References
Here are some references that I used for this writing:
- Ritchie, H., Roser, M., & Pablo, R. (2020). Emissions by sector. https://ourworldindata.org/emissions-by-sector
- Satriawan, G. A. (2022). Kinerja Thermal Sistem Hybrid VC - PCM (Vapour Compress—Phase Change Material) Pada Eco Reefer Container [Bachelor Thesis]. Institut Teknologi Sepuluh Nopember.
- Srivatsa, S. G., Bharadwaj, K., & Alamuri, S. L. (2021). Smart Cold Storage and Inventory Monitoring System.
- United Nations. (2015). Paris Agreement. https://climate.ec.europa.eu/eu-action/international-action-climate-change/climate-negotiations/paris-agreement_en
- UNCTAD. (2022). Review of Maritime Transport: Navigating Stormy Weather.
These are not full references for this project, rather they are some of references that are used for this simplified writing.